
Projects.
Updating our predictions with new data: basketball edition
We start the season thinking our team is this good (or bad). But as the wins and losses pile up, how do we update our priors?
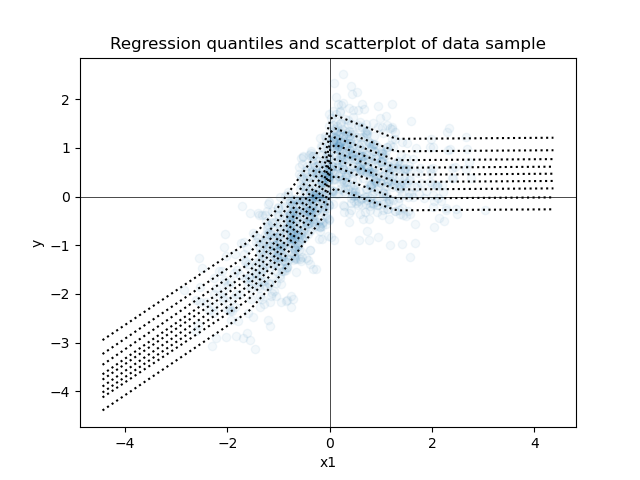
Beyond Point Estimates
When we need to predict more than just a mean or a median, full posterior distributions from Bayesian models are often the way to go. But sometimes, that’s too computationally intensive and we need some shortcuts. Quantile regression is a handy alternative. For even more efficiency, we can use multi-task learning so that a single model produces all the quantiles we want.
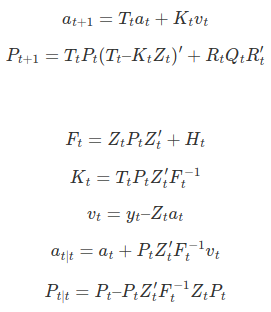
State-Space Models: Learning the Kalman Filter
Different research fields may speak different mathematical languages. There’s nothing like rigorous software testing for accurate translation.
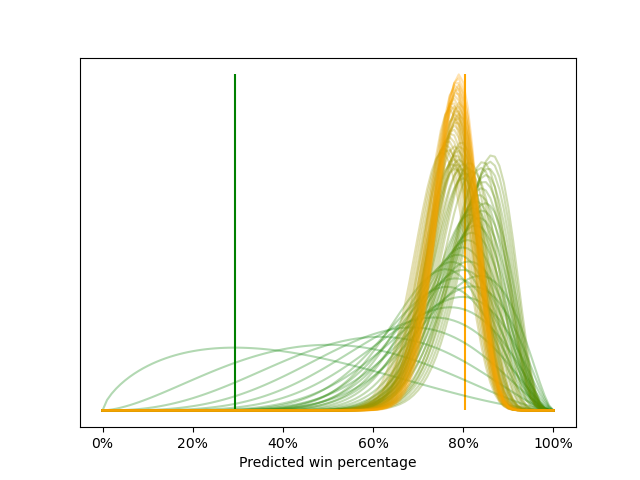
Updating Our Predictions with New Data: Visualizing 3 Choices
As we add outcomes to our model, the concepts stay the same but the dynamics grow more complex. Viewing animations of the model can help us develop intuitions about how it works.
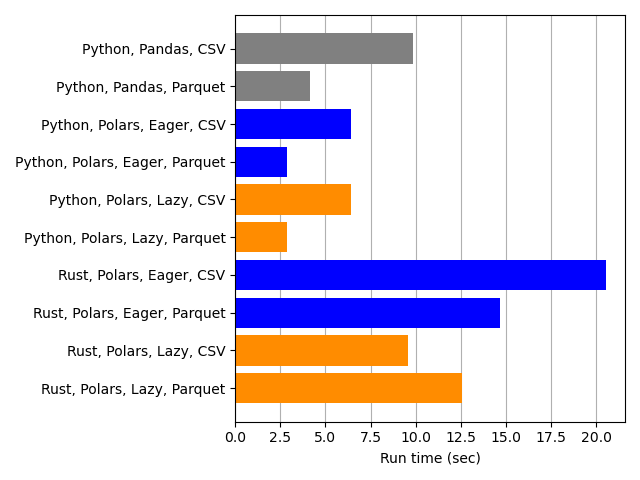
How fast is Polars compared to Pandas?
Benchmarks are nice, but how fast are our favorite data tools on realistic data workflows?
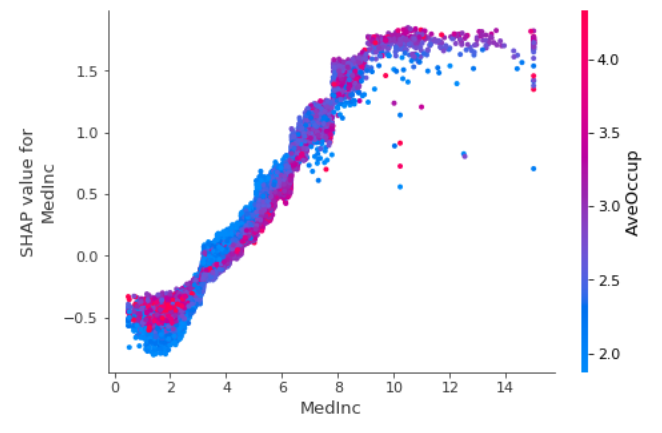
SHAP tutorial
How do we use Shapley values to interpret machine learning models?
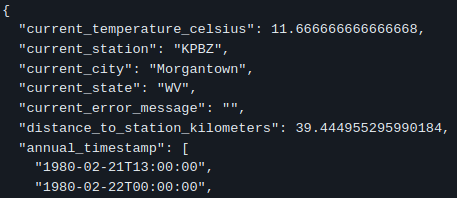
Weather and climate API
Using mock testing and FastAPI to query, create, and test web APIs.
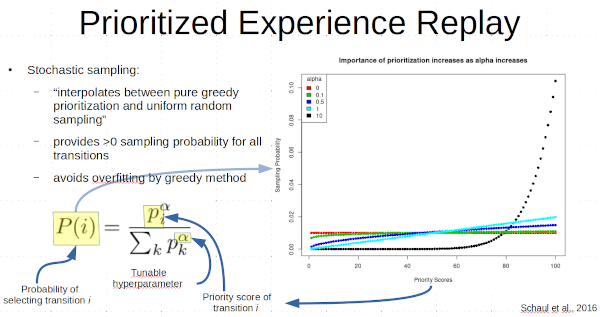
Deep reinforcement learning and Rainbow
How does a computer learn to play video games?
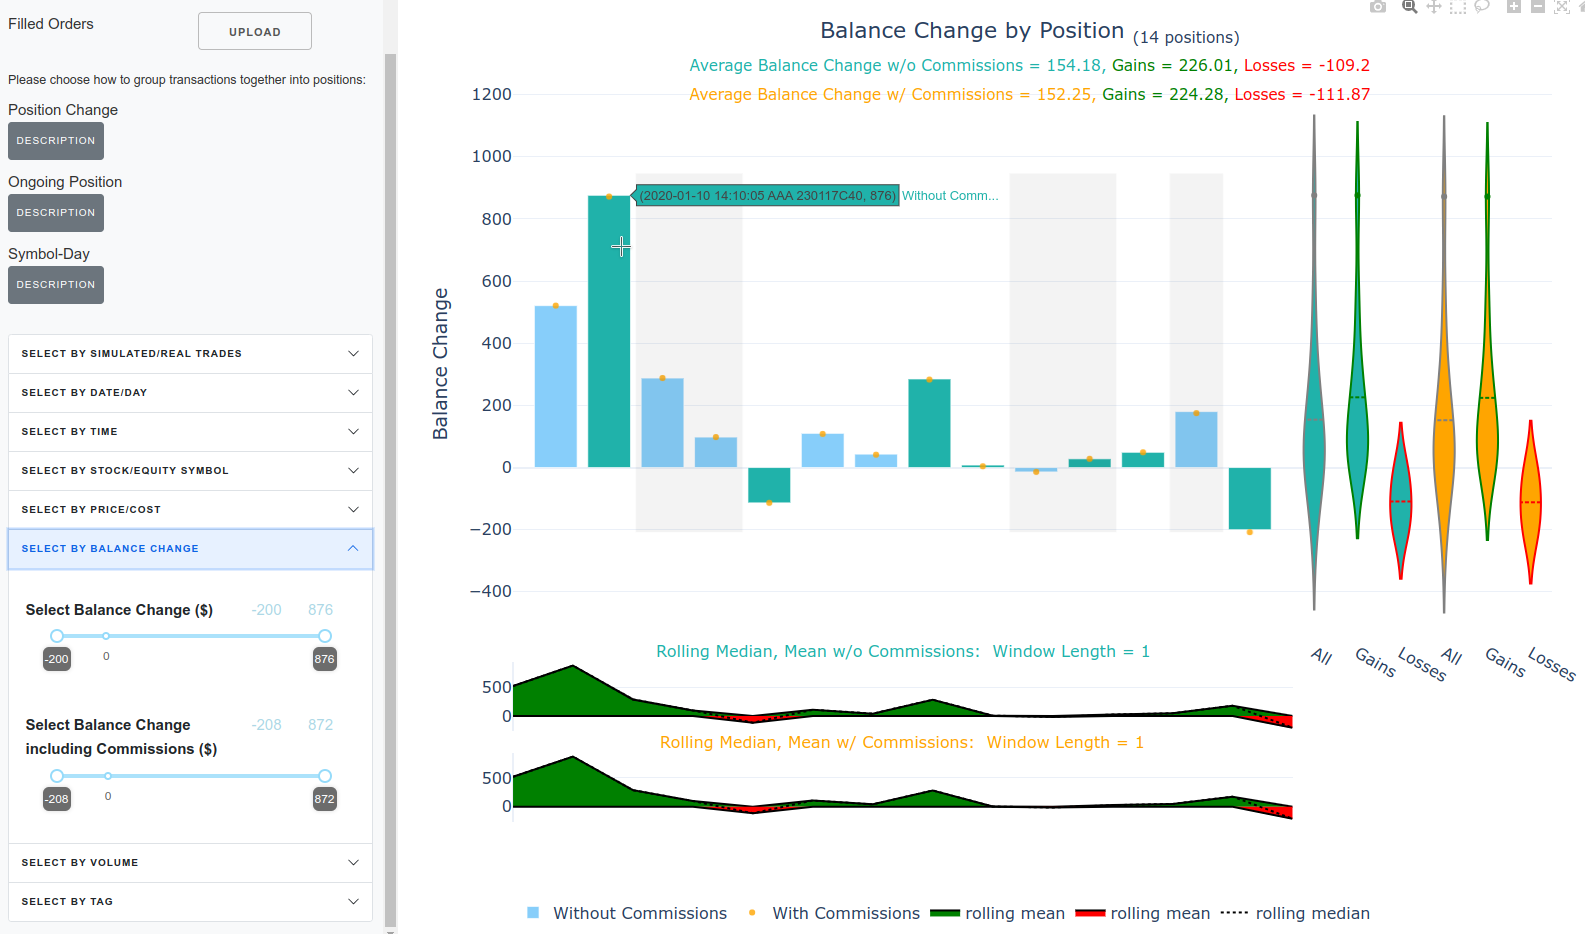
Investment performance metrics dashboard
Plotly Dash app for tracking profit/loss and other investment performance per transaction or over time.
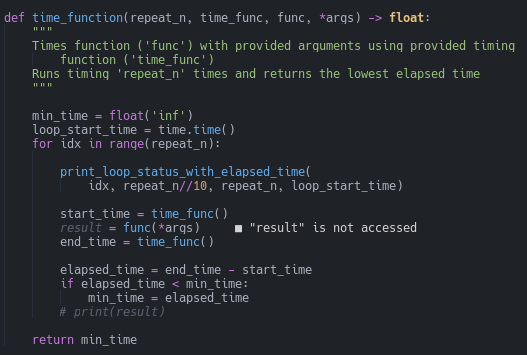
Add Columns to Polars DataFrames Quickly
There are straightforward, slow ways to do things, and then there are faster ways. Know how to choose.
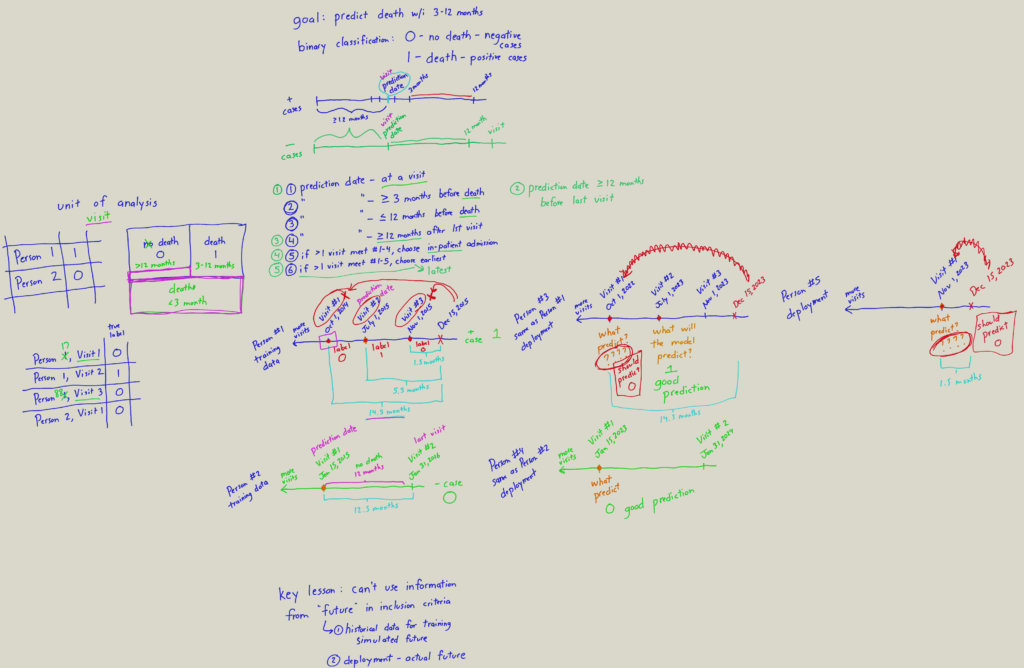
Case Study: How to Translate a Healthcare Problem into a Predictive Modeling Problem
How do we correctly select cases for our training data?
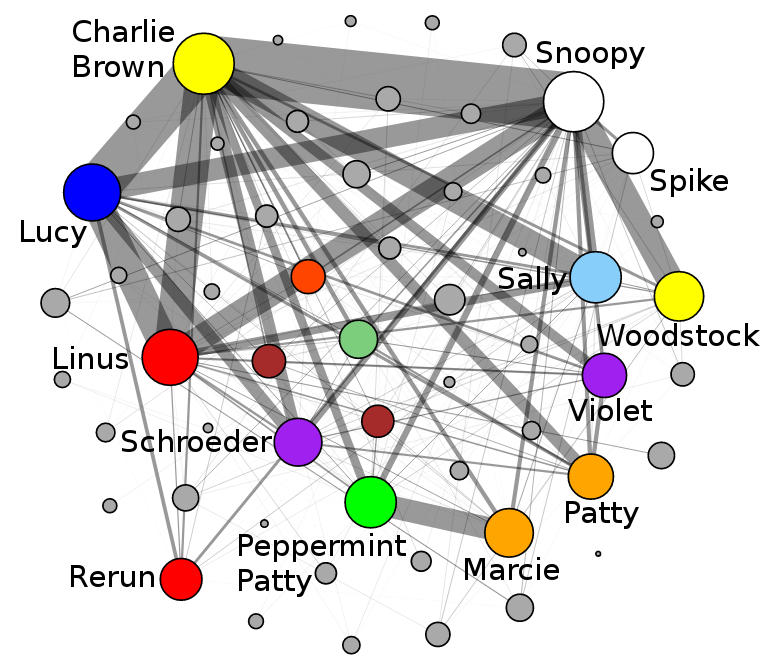
The Peanuts Project
Charlie Brown, Snoopy, Lucy, Linus . . . who was the most important character? Which of their relationships was the strongest? Indulge some nostalgia and hum some Guaraldi!
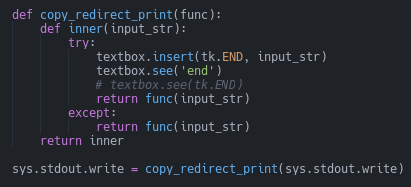
Monitoring Data Pipelines: Airflow and Tcl/Tk
Airflow is terrific for scheduling and monitoring data pipeline components. But we also want to monitor in real-time what’s happening inside those components.
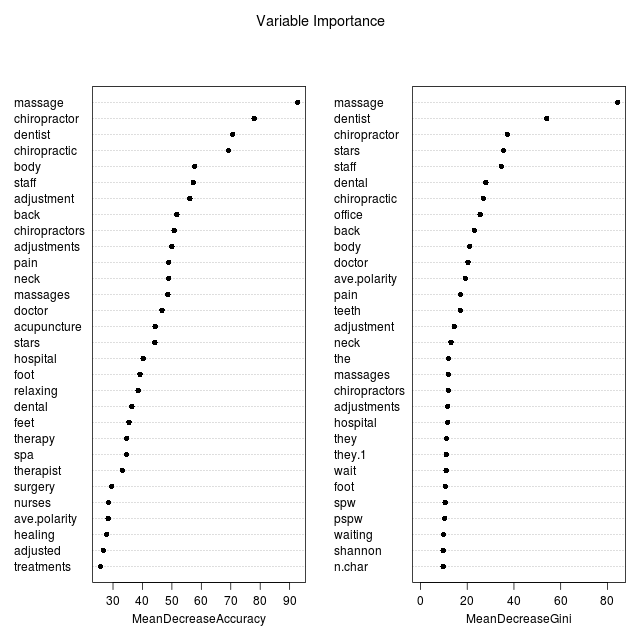
Classifying medicine
How do patients experience conventional and alternative medicine differently? Yelp, random forests, ROC curves, and so much more!
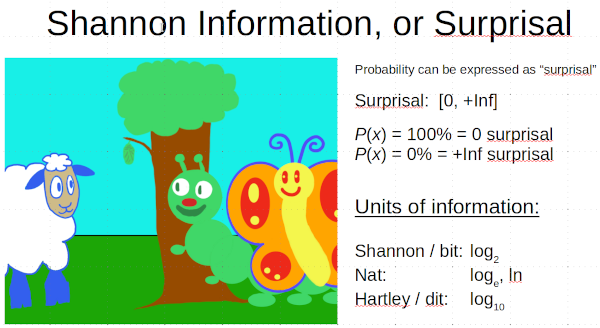
Information theory for toddlers
A low-entropy bedtime story